


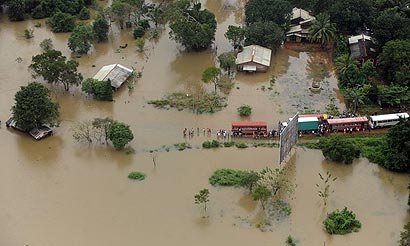
ආපදා හේතුවෙන් විපතට පත්වූවන් සඳහා සහන සැලසීමේ යාන්ත්රණය සහ සෙවීම් සහ මුදවාගැනීම් යාන්ත්රණය
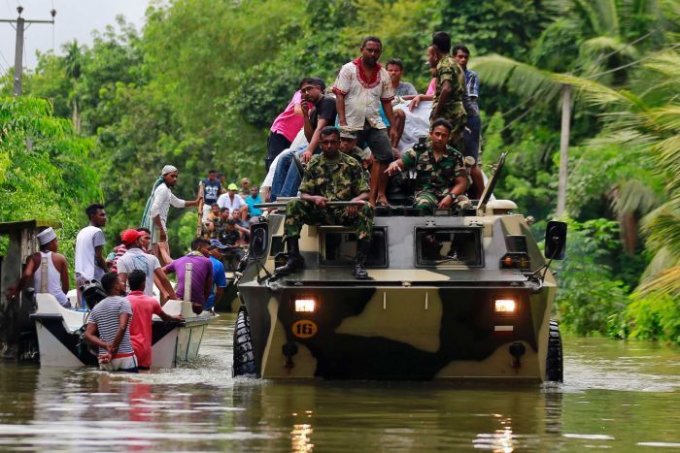
ඊසානදිග මෝසම් සක්රීයවීම හේතුවෙන් පවතින අයහපත් කාලගුණික තත්ත්වය හේතුවෙන් ඇතිවු ගංවතුර, අධික සුළං, අකුණු, පස් කණ්ඩි කඩාවැටීම් සහ ගස් කඩාවැටීම් ආදී ආපදා හේතුවෙන් විපතට පත්වූවන් සෙවීම් මුදවාගැනීම් සහ සහන සැලසීමේ යාන්ත්රණය ...

සුනාමි ව්යසනයට විසි වසරක්, ජාතික සුරක්ෂිත දින සැමරුම
2004 වර්ෂයේ සුනාමි ව්යසනයෙන් අප රටේ 35,000 කට අධික පිරිසක් මිය ගිය අතර පුද්ගලයින් 5,000 කට වැඩි පිරිසක් අතුරුදහන් වුණ අතර දේපළ, පරිසරය, යටිතල පහසුකම් විනාශ ගණනය කිරීමේ දී රුපියල්...

භූ කම්පනයක දී අප කුමක් කරමුද? ඒ පිළිබදව දැනුවත් වන්න
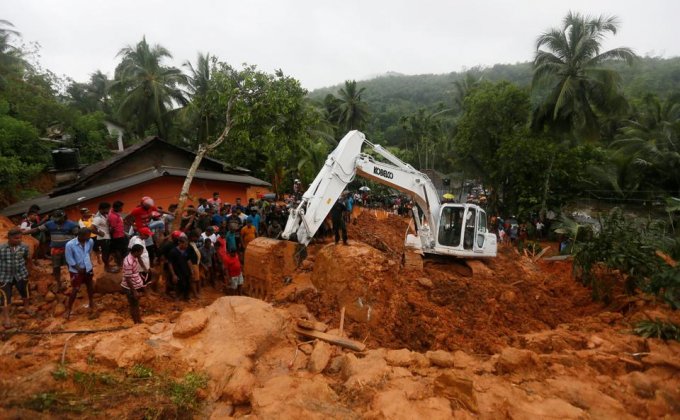
පසුගිය වර්ෂයේ පෙබරවාරි මස මොරාගල දිස්ත්රික්කයේ අවස්ථා කීපයක දී භූචලන වාර්තා විය. ඉන් පළමු වැන්න පෙබරවාරි මස 10 වන දින බුත්තලපැලවත්ත සීනි කර්මාන්ත ශාලාව ආසන්න ප්රදේශය වාර්තා වු අතර...
ආපදා හේතුවෙන් විපතට පත්වූවන් සඳහා සහන සැලසීමේ යාන්ත්රණය සහ සෙවීම් සහ මුදවාගැනීම් යාන්ත්රණය
ඊසානදිග මෝසම් සක්රීයවීම හේතුවෙන් පවතින අයහපත් කාලගුණික තත්ත්වය හේතුවෙන් ඇතිවු ගංවතුර, අධික සුළං, අකුණු, පස් කණ්ඩි කඩාවැටීම් සහ ගස් කඩාවැටීම් ආදී ආපදා හේතුවෙන් විපතට පත්වූවන් සෙවීම් මුදවාගැනීම් සහ සහන සැලසීමේ යාන්ත්රණය ...
සුනාමි ව්යසනයට විසි වසරක්, ජාතික සුරක්ෂිත දින සැමරුම
2004 වර්ෂයේ සුනාමි ව්යසනයෙන් අප රටේ 35,000 කට අධික පිරිසක් මිය ගිය අතර පුද්ගලයින් 5,000 කට වැඩි පිරිසක් අතුරුදහන් වුණ අතර දේපළ, පරිසරය, යටිතල පහසුකම් විනාශ ගණනය කිරීමේ දී රුපියල්...
භූ කම්පනයක දී අප කුමක් කරමුද? ඒ පිළිබදව දැනුවත් වන්න
පසුගිය වර්ෂයේ පෙබරවාරි මස මොරාගල දිස්ත්රික්කයේ අවස්ථා කීපයක දී භූචලන වාර්තා විය. ඉන් පළමු වැන්න පෙබරවාරි මස 10 වන දින බුත්තලපැලවත්ත සීනි කර්මාන්ත ශාලාව ආසන්න ප්රදේශය වාර්තා වු අතර...
ආපදා හේතුවෙන් විපතට පත්වූවන් සඳහා සහන සැලසීමේ යාන්ත්රණය සහ සෙවීම් සහ මුදවාගැනීම් යාන්ත්රණය
ඊසානදිග මෝසම් සක්රීයවීම හේතුවෙන් පවතින අයහපත් කාලගුණික තත්ත්වය හේතුවෙන් ඇතිවු ගංවතුර, අධික සුළං, අකුණු, පස් කණ්ඩි කඩාවැටීම් සහ ගස් කඩාවැටීම් ආදී ආපදා හේතුවෙන් විපතට පත්වූවන් සෙවීම් මුදවාගැනීම් සහ සහන සැලසීමේ යාන්ත්රණය ...


Related Links
 National Building
 Department of

Call Center
117+94 112 670 002